In the world of software engineering, having clear and concise design documents is truly essential for the development process. They ensure that everyone involved in the project understands its layout and requirements. However, creating these documents can be challenging at times especially when we rely heavily on text alone. This is where diagrams and visuals come in handy.
This blog explores the significance of including diagrams and visuals to enhance your software design documents. You’ll learn about their benefits, the different types you can use, how to seamlessly integrate them, and how they can transform your design documentation. By the end of this article, you’ll gain an insight into how using diagrams and visuals can improve the effectiveness and attractiveness of your software design documents.
The Importance of Diagrams and Visual Aids in Improving Software Design Documents
Using Diagrams and Visual Aids vs Relying on Text
Diagrams and visual aids bring numerous benefits compared to relying solely on textual documentation. Primarily they simplify the comprehension of information. A crafted diagram can showcase relationships and procedures more effectively than a lengthy text bloc. This visual clarity minimizes confusion and ensures alignment for all the readers.
Moreover, visuals can emphasize elements of the design facilitating the identification of issues or areas needing enhancement. They also accommodate learning preferences as some team members may grasp concepts easily through visual representations rather than written explanations. Ultimately integrating diagrams and visual aids can streamline the development process fostering efficiency and collaboration within the team.
Kinds of Diagrams Used in Software Design

There are several kinds of diagrams and visuals that play a major role in improving your software design papers. Each one has a role. and can be used at various points of the design process. Some popular types consist of:
- Flowcharts: These diagrams illustrate the flow of a process or system, making it easy to understand the sequence of steps and decision points.
- UML Diagrams: Unified Modeling Language (UML) diagrams, such as class diagrams, sequence diagrams, and activity diagrams, help visualize the structure and behavior of a system.
- Wireframes: These low-fidelity visual representations of a user interface show the layout and functionality of a design without getting bogged down in details.
- Entity-Relationship Diagrams (ERDs): These diagrams depict the relationships between entities in a database, helping to design and understand data models.
- Architecture Diagrams: These visuals illustrate the overall structure of a system, including its components, relationships, and interactions.
How to Select the Right Diagram Type
Choosing the diagram or visual depending on the phase of the design process is crucial. The selection depends on the stage of the process and the specific details you want to convey. Here are some tips to help you make the decision:
Early Stages:
- Use flowcharts to outline broad processes and pinpoint critical decision points.
- Create high-level architecture diagrams to showcase the system structure and interactions.
- Create wireframes to visualize the layout and functionality of the user interface.
Mid Stages:
- Use UML diagrams to elaborate on system structure and behavior.
- Use ERDs to comprehend data models and relationships.
Late Stages:
- Update all your diagrams to reflect any architectural changes.
- Enhance wireframes into more detailed mockups for finalizing user interface design.
By choosing diagrams and visuals for each phase you can effectively communicate information in your design documents to your team.
Best Practices for Using Diagrams and Visual Aids Effectively
Maintaining Design Consistency in Documentation
Consistency plays a massive role when integrating diagrams and visuals into your design documents. Make sure that all diagrams adhere to a style and use similar symbols and notations. This uniformity helps team members grasp the visuals easily and minimizes the learning curve for new team members.
Moreover, stick to a layout and format throughout all your documentation. Use the same font, color palette, and spacing to establish a polished appearance. This meticulous approach not only improves readability but also showcases your dedication to quality and accuracy.
Using Tools That Facilitate Version Control and Collaboration
To efficiently handle design documents collaboratively, opt for tools that support version control and collaboration. Platforms such as Lucidchart, and draw.io provide functionalities that enable team members to collaborate on diagrams simultaneously while tracking changes over time.
Version control proves essential in maintaining a record of your design choices. It ensures that everyone is working with the right document version and enables you to revert to earlier versions if necessary. Collaborative tools also promote communication and teamwork by facilitating real-time sharing of insights and feedback within your team.
Tips for Making Visuals Easy to Understand and Manage

Creating visuals that are easy to understand and maintain requires planning and attention to detail. Here are some tips to help you achieve this:
- Keep It Simple
- Avoid clutter and unnecessary details. Focus on the essential elements and relationships.
- Use labels to describe components and connections concisely.
- Use Standard Symbols and Notations
- Stick to widely recognized symbols for easier understanding by all team members.
- Provide a legend if custom symbols are used.
- Organize Hierarchically
- Arrange elements with higher-level components at the top. This structure helps in understanding how the system is organized.
- Maintain Visual Balance
- Distribute elements across the diagram to avoid overcrowding. This enhances readability and ensures that there is no visually dominant area.
By following these guidelines you can create diagrams and visuals that effectively convey information in a maintainable format over time.
Comparison of Design Documents Before and After Adding Visuals
Let’s explore the difference diagrams make by examining two excerpts of a design document for a software project. The initial document is text only whereas the second one includes several diagrams and visuals.
Before – Text-Only Design Document
In the text-only document, key information is buried in lengthy paragraphs and difficult to parse. For example:
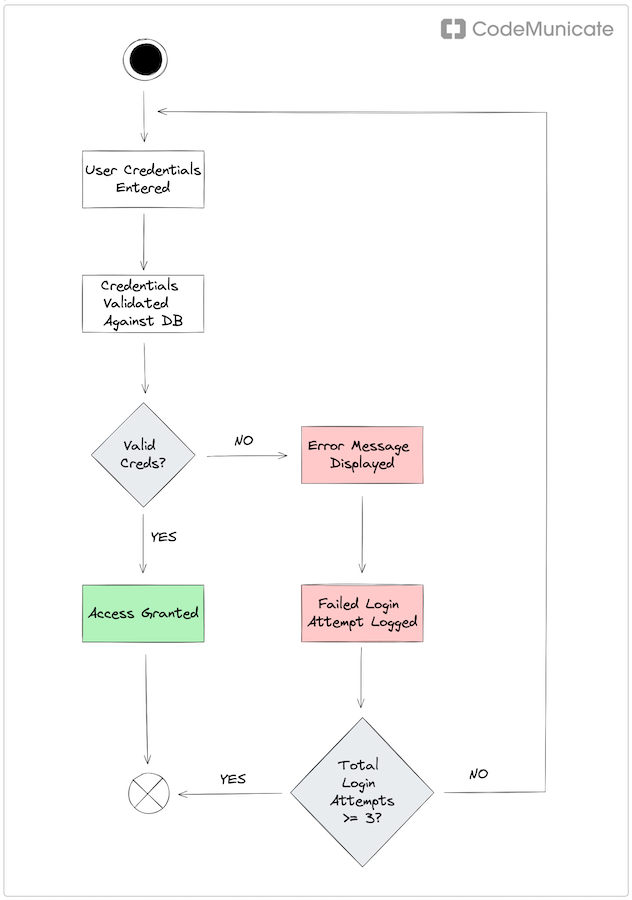
“The user authentication process involves several steps. First, the user enters their credentials on the login page. The system then checks the credentials against the database. If the credentials are valid, the user is granted access to the system. If the credentials are invalid, an error message is displayed. Additionally, the system tracks login attempts and locks the account after three failed attempts.”
After – Enhanced Design Document with Visuals
In the enhanced document, the same information is presented with a UML activity diagram with a clear title:

We can see here that this diagram provides a clear illustration of the steps and decision points making the process very easy to understand. This visual aid improves comprehension and lowers the chance of confusion. Night and day difference!
Conclusion

Incorporating diagrams and visuals in software design documents provides many advantages. They make complex information easier to understand and highlight key aspects of the design while catering to different learning styles. By choosing diagrams for each design phase and adhering to practices you can produce clear, concise, and efficient design documents that promote collaboration and streamline the development process.
Remember the saying that a picture’s worth a thousand words? Start integrating diagrams and visuals into your design documents today to witness the impact they can have.
Need help with your technical communication as a software engineer? Get in touch with CodeMunicate today to learn how our communication coaching can help you boost your software engineering career.

